Turku BioImaging Black Book
Turku BioImaging covers the whole spectrum of imaging, from nanoscale and cellular imaging to small animal and medical imaging, as well as analysis.
Imaging truly “from atoms to anatomy”
View the original PDF here
-
Electron Microscopy
Electron Microscopy
What is it for?
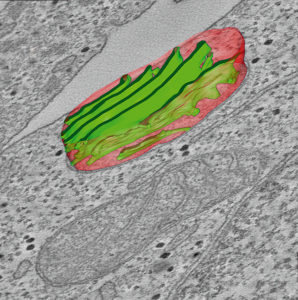
Electron microscopy is the method of choice if detailed structural information at nanometre resolution is required from samples of macromolecules, nanoparticles, viruses, bacteria, cells, tissues and other related materials. The Laboratory of Electron Microscopy at the University of Turku is a core facility that provides electron microscopes and related services for investigators within the Turku area and also for scientists from all over Finland. Provided techniques include conventional Transmission and Scanning Electron Microscopy (TEM/SEM), Correlated Light and Electron Microscopy (CLEM) and Electron Tomography.
How does it work?
Electron microscopy is an imaging technique that relies on an electron beam to visualise the sample. Use of electrons, instead of photons, potentially allows imaging at the nanometre scale. The interactions of electrons with a specimen are also used to provide information on the fine structure in electron diffraction experiments. In TEM, the interactions of electrons transmitted through an ultrathin (60 nm) section of a specimen are imaged. In SEM, a focused electron beam is scanned over the sample surface and an image is derived from secondary or backscattered electrons emitted from the specimen.
Things to consider
For TEM, biological samples must usually be fixed with aldehyde, dehydrated and embedded in epoxy or another appropriate resin before being cut into thin sections. In addition, cellular components need to be stained with heavy metals for a reasonable contrast. For SEM, samples are dehydrated and often coated with a thin layer of conductive material, such as gold or carbon. Macromolecules or nanoparticles can be imaged even without fixing or staining, but it should be kept in mind that the ultra-high vacuum and intense electron beam may affect unstained samples.
- High resolution imaging for a wide range of samples.
- Transmitted or backscattered electrons used for image formation.
- Sample preparation and harsh imaging conditions may affect the sample.
-
Atomic Force Microscopy
Atomic Force Microscopy
What is it for?

Atomic Force Microscopy (AFM) is primarily used to image surface topography. With functionalised probes, it can also be used to measure specific binding forces between molecules such as receptors and ligands, or between cells and a substrate. AFM imaging is suitable when the resolution of optical microscopy is not sufficient, when a sample needs to be imaged under native physiological conditions, or when the type of sample preparation required for electron microscopy is not possible. In addition, AFM can be used to manipulate objects, e.g. to study the effects of specific mechanical stimuli on cells.
How does it work?
AFM is a type of scanning probe microscopy technique, in which a sharp tip on a flexible spring-like cantilever mechanically scans over a specimen’s surface and senses the forces between the tip and the surface. Such forces cause the cantilever to bend, and the deflection is measured using a laser beam reflected from the cantilever. The AFM can be operated in liquid and under physiological conditions, making it possible to study living biological specimens. The technique is label-free, making sample preparation straightforward. Biological AFM is often coupled to optical microscopy.
Things to consider
AFM acquires the surface topography of specimens. Thus, AFM is limited in studying the internal features of the specimen. Selecting a proper probe (spring constant, tip shape, resonant frequency, and surface functionality) is critical.
AFM utilises mechanical contacts between probes and sample surfaces; therefore, it is prone to noise and vibrations coming from the surroundings. Care must also be taken that these mechanical contacts do not damage the specimen. AFM also requires relatively long image acquisition times (typically several minutes to tens of minutes) and its field of view (scan area) is often smaller than with commonly used optical microscopes.
- Mechanical probing can be used for visualising the topography of a surface, its mechanical properties and biological affinity.
- Possible to image biological samples in liquid in their native state.
- Correlative studies combining confocal light microscopy with AFM are possible.
-
STED Microscopy
STED Microscopy
What is it for?
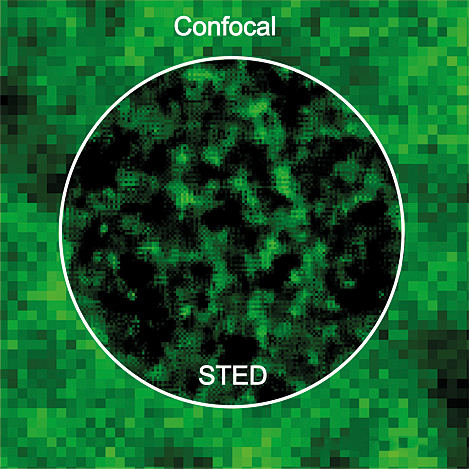
Stimulated Emission Depletion (STED) microscopes provide improved optical resolution (super-resolution) and are the instrument of choice when the resolution of normal confocal microscopy is insufficient and electron microscopy is not suitable. Compared with conventional confocal microscopy, STED microscopy provides 3 – 10 fold improvement in lateral (x-y) resolution and in some instruments axial resolution (z-resolution) as well. A STED instrument can be used in a similar manner to a confocal fluorescence microscope, and thus can provide non-invasive imaging of (living) specimens in three dimensions (3D).
How does it work?
STED microscopy is a type of confocal fluorescence microscopy. Compared with the diffraction-limited resolution by conventional wide field and confocal fluorescence microscopes (180 – 300 nm), STED can provide a resolution beyond the limit, down to 20 nm in biological samples. In STED microscopy, a doughnut-shaped highpower laser, called a STED beam, is overlaid on an excitation laser spot. Under the doughnut, spontaneous fluorescence emission is suppressed and the size of an effective emission spot is reduced. This is how the resolution is improved in STED microscopy.
Things to consider
Samples for STED are prepared similar to those for confocal microscopy. The Abberior Instruments STED is compatible with fluorescent proteins, e.g. GFP, YFP, mCherry as well as organic dyes, such as Star488, Star520SXP and Star635P. In STED, very good staining is essential and we recommend higher concentration of antibodies and/or dyes than those used for confocal microscopy. For the best possible resolution, specific mounting media, TDE and Mowiol, are highly recommended; water can be used as well. In addition, thickness-corrected glass coverslips should be employed, if available.
- Super-resolution technique for specimens stained fluorescently.
- Based on the stimulated emission depletion-phenomenon.
- Requires high density of labelling fluorophores in the sample.
-
Widefield microscopy
Widefield microscopy
What is it for?
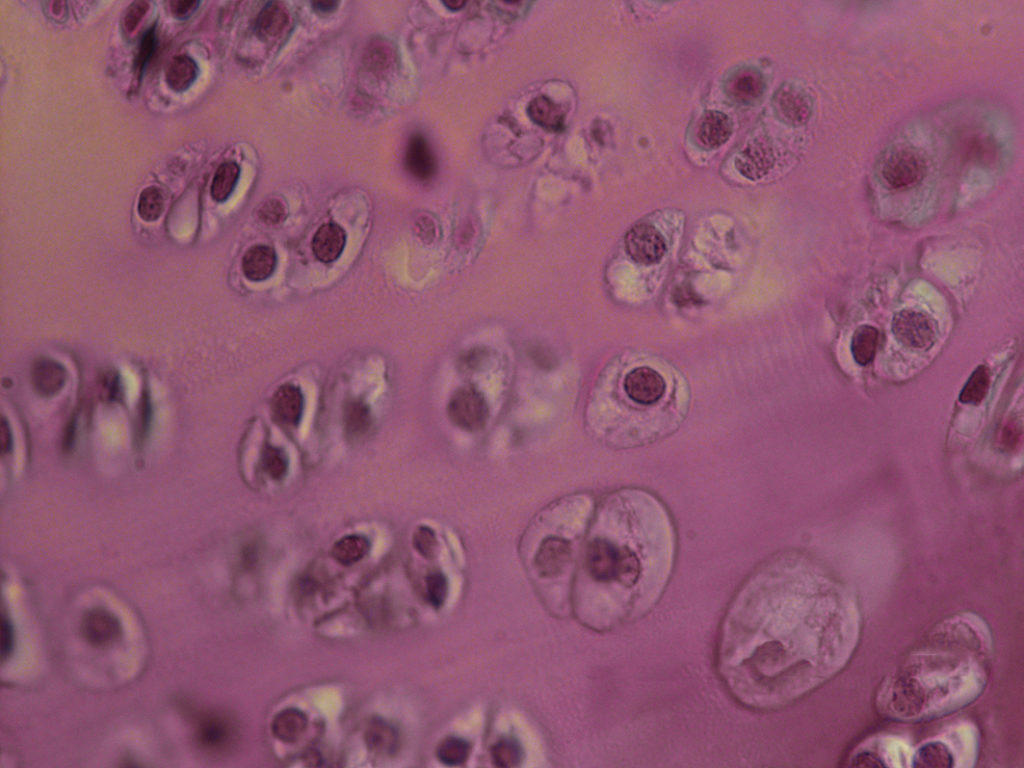
A widefield microscope is an optical microscope that can use fluorescence and phosphorescence in addition to reflected and transmitted light to image and study cells, tissues, and a large variety of other samples. Most common studies in widefield microscopy are of fixed cells or tissue sections either labelled or expressing fluorescent reporters. Histologically stained samples, plant sections and living cells can also be studied. Widefield microscopy is a fast and efficient method to produce images for standard use such as optimisation of fluorescent reporters and the study of cell morphology. Additional contrasting methods, such as differential interference contrast (DIC), Hoffman modulation contrast (HMC) and phase contrast can be used to better visualise morphologies.
How does it work?
In widefield microscopy, the whole field of view in the sample is illuminated simultaneously. The source of light is usually a mercury lamp producing high intensity light with a broad spectrum of wavelengths. In fluorescence microscopy optical filters are used in order to select the wavelength of excitation light that is directed to the sample via a dichroic mirror. The fluorescent light is usually detected with a CCD camera or by eye. Multi-colour images of several types of fluorophores can be composed by combining several singlecolour images or by using dual filter blocks. In brightfield microscopy, transmitted light can be simultaneously detected by attaching a black and white (b/w) or a colour camera. Fluorescence and brightfield images can then be overlaid.
Things to consider
Sample preparation is as important for the experiment as is the imaging step. It is important to know which filter sets and objectives are installed on the chosen instrument to choose the correct fluorophores, coverslips and mounting media. Also, illumination has to be optimised, as the applied light during imaging can bleach fluorophores. If the experiment requires live-cell imaging, it is necessary to use an inverted microscope. Cells should be grown on a special imaging dish and light exposure should be minimised as phototoxicity can damage the cells and alter cellular functions.
- Optical microscope for fluorescent and brightfield imaging.
- Ideal to study fixed cells or thin tissue samples.
- For best results, it is important to know which filter sets and objectives are installed on the chosen instrument.
-
Confocal microscopy
Confocal microscopy
What is it for?

Confocal microscopy is currently the most commonly used fluorescence microscopy technique to study the 3D distribution of proteins and cellular components in cells and tissues. It can be used to image fixed and living cells, and when combined with advanced software, it gives rise to a large variety of additional techniques. With confocal microscopy one can follow dynamic processes, such as the uptake of labelled molecules or the kinetics of intracellular trafficking. In addition, diffusion properties of labelled molecules can be followed using FRAP and fluorescence correlation spectroscopy techniques. Finally, molecular interactions at short distances can be detected by fluorescence resonance energy transfer (FRET) experiments.
How does it work?
Unlike widefield fluorescence microscopy techniques, confocal microscopy has the ability to collect fluorescence from a thin layer of the sample, enabling precise focusing on the region of interest. The confocal microscope uses a pinhole in front of the detector to confine the detection of emitted light to a very thin layer in the sample, often referred to as the focal plane. A highly focused highspeed laser beam is scanned across the specimen causing excitation of fluorophores. The subsequent emission can be detected through the pinhole. The specimen is scanned in several focal planes creating a 3D-image stack. Data from complete optical sectioning can then be used to construct a real 3D-image that can be visualised and analysed with suitable software such as BioImageXD.
Things to consider
Sample preparation and selection of a suitable instrument are as important as the imaging for the success of an experiment. Before choosing suitable fluorophores and mounting media, it is important to know which laser lines, filters and objectives are available in the selected instrument. Additionally, when conducting a live-cell experiment, special equipment should be used and turned on before the experiment. More advanced instrumentation, such as spinning disk microscopy, TIRF and two-photon microscopy are available at TBI. Please contact the CIC to help you select the correct instrument for your specific purpose.
- Enables imaging of cells and tissues in 3D with good resolution.
- Both fixed and living cells can be studied.
- Advanced functional light microscopy techniques (FRET, FRAP etc.) are available.
-
Spinning disk confocal microscopy
Spinning disk confocal microscopy
What is it for?
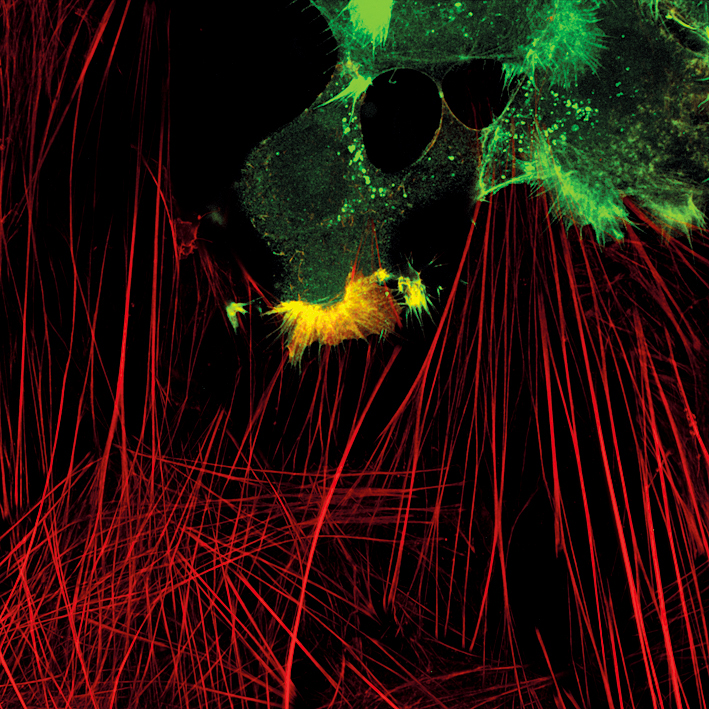
Spinning disk confocal microscopy offers high imaging speed with low phototoxic effects, which is ideal for live-cell imaging. However, the system is also a practical tool for all cell biology experiments, where fast 3D imaging is needed including: tile imaging, optical sections of thick samples etc. Due to the high imaging speed, the system allows imaging of multiple positions in 3D in live-cell imaging experiments with reasonable time intervals. Emission detection of a spinning disk system is based on cameras with a low noise level compared to laser scanning systems, which produce beautiful images with a high signal to noise ratio. One of the special features of the setup is a near infrared (NIR) excitation laser, which now makes it possible to use five labels at a time. This system has also the Vector FRAP module for photomanipulation assays. All the laser lines are available for photomanipulation.
How does it work?
Spinning disk confocal microscopy is based on laser beams directed through the Nipkow disk with thousands of small pinholes, which produce thousands of excitation beams that are swept across the specimen as the disk spins. Thus, a whole field of view can be illuminated very fast. The resulting emission signal from the sample is transferred through the spinning disk to cameras, which are used for detection instead of photon detectors used in laser scanning systems.
Things to consider
Data storage and image analysis steps must be planned carefully; the sCMOS camera produces large sized RAW files when full frame is used. For example, the size of a full 3D stack of a cell is around 1GB (4 channels, 30 optical sections). The photomanipulation module is easy to use, and the fast imaging speed makes the system attractive for performing FRAP experiments. Photomanipulation can also be set up and executed on the fly, which is useful e.g. in photoactivation experiments.
- For fast and minimally invasive 3D/4D imaging of fluorescently labelled specimen.
- Camera detector allows high signal to noise ratio.
- FRAP photomanipulation experiments available.
-
TIRF microscopy
TIRF microscopy
What is it for?
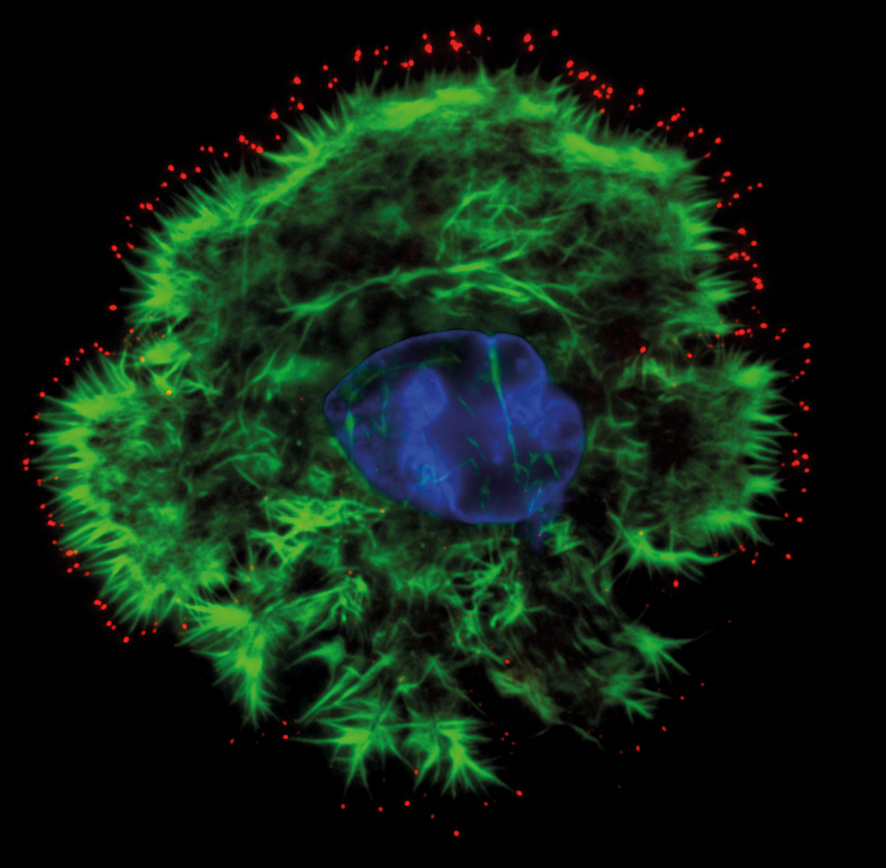
Total Internal Reflection Fluorescence microscope (TIRF) is a tool to image structures and molecular events at the cell membrane with a high z-resolution – usually less than 200 nm. Typical applications are cell adhesion, ligand binding and endosomal trafficking studies of fixed and live cell samples. TIRF microscopes have sensitive components in common, which make them good tools for all kind of widefield microscopy.
How does it work?
In a TIRF microscope, an excitation laser is directed to a sample from a specific angle, so that instead of penetrating the sample, the laser beam exhibits a total reflection at the interface of a cover glass and sample medium. This is possible only in the case of high NA objectives and a sufficient difference in refractive indices of the two materials at the interface (i.e. cover glass/water). Although the laser beam is reflected at the cover glass-sample interface, a small proportion of the light travels parallel along the cover glass, which creates a physical phenomenon called an evanescent field in a very restricted volume in aqueous phase. The evanescent field diminishes logarithmically as it enters deeper into the medium, and only the fluorophores near the interface are excited resulting in a z-resolution of 70-300 nm.
Things to consider
The sample must be in PBS or in cell imaging medium to achieve total internal reflection. The whole cell volume can be imaged in widefield, but TIRF resolution is restricted only to the cell membrane facing the cover glass. TIRF is very sensitive to all variables affecting the light path, and a user must pay extra attention to a sample, glass-bottom sample dishes, immersion oil, objectives, sample holders, etc.
- Usefull technique for studying cellular membranes and their function.
- Total reflection confines fluorophore excitation in a very thin layer facing the cover glass.
- Requires high optical grade materials for sample preparation.
-
Two-photon microscopy
Two-photon microscopy
What is it for?
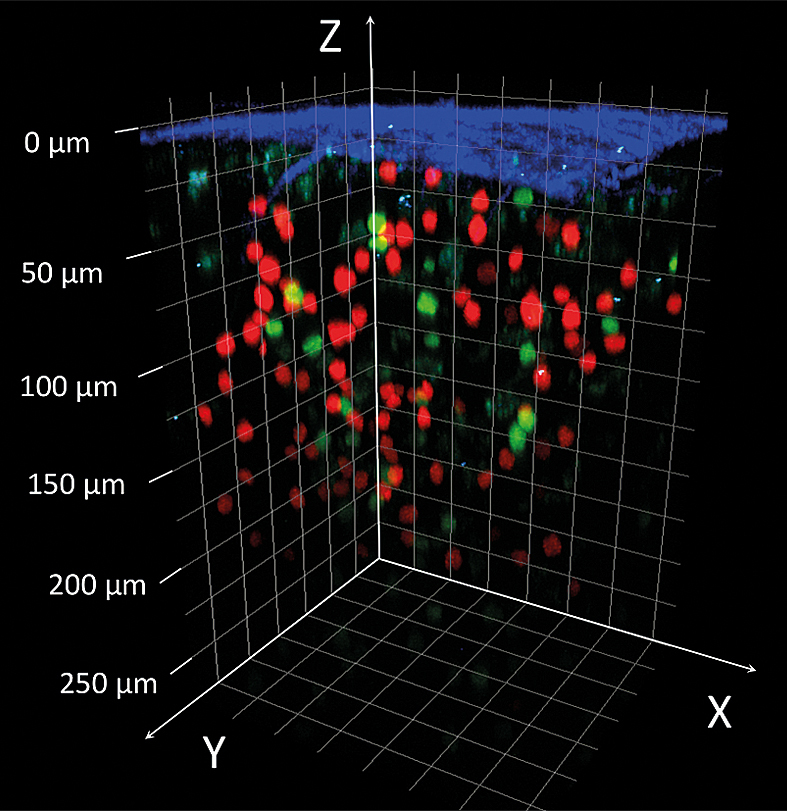
Two-photon microscopy is a laser-scanning microscopic technique typically used for the acquisition of 3D time-lapse images of living samples. As a major advantage, it allows a greater penetration depth into tissues than what is possible with conventional confocal microscopy (several hundred μm versus ~80 μm). Moreover, it induces less phototoxicity effects in living samples. This technique is thus ideally suited for intravital imaging in living, anaesthetised animals or living, explanted tissues.
How does it work?
Like confocal microscopy, two-photon microscopy allows optical sectioning of fluorescently-labelled samples, although on the basis of a different principle. In conventional fluorescence, excitation of a single photon (emitted by a visible-light or UV continuous-wave laser) absorbed by a fluorophore molecule is sufficient for its fluorescence. In contrast, two-photon excitation occurs after the nearsimultaneous absorption of two photons (emitted by an infrared, femtosecond-pulsed laser), each of which carries only half of the energy needed. Since two-photon excitation events are rare, they only occur at places with a high density of photons, i.e. at the focal point. The result is fluorescent excitation occurring exclusively in the focal plane, not above or beneath it. Thus, optical sectioning is an inherent property of the technique, and no pinholes are needed. Signal detection is achieved by using close-coupled, highly sensitive non-descanned (external) PMT detectors. The utilisation of high excitation wavelengths results in greater tissue penetration, and due to confined excitation within the focal plane phototoxicity is significantly reduced.
Things to consider
While the technical setup is simple and the instrument is easy to operate, imaging experiments on living tissue require a lot of practice. If cells or tissues are labelled with a vital dye, e.g. CFSE, labelling conditions have to be carefully optimised and the combination of dyes (in the case of multicolour experiments) has to be carefully planned. In the case of in vivo imaging experiments, the microsurgical procedures usually require a lot of practice as well.
- Good penetration and low phototoxicity for live tissue imaging.
- Simultaneous absorption of two low energy photons excites the fluorophore.
- For intravital microscopy of living animals.
-
Stereo microscopy with microinjection
Stereo microscopy with microinjection
What is it for?
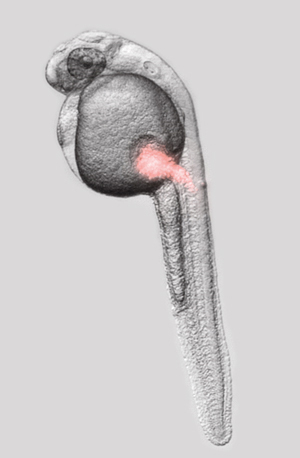
A stereo microscope is an optical microscope suitable for studying several kinds of samples, for example cell cultures, animal and plant tissues, whole plants, zebrafish, eggs (CAM model) and insects. The stereo microscope at TBI is equipped with 0.8x and 1.2x long working distance objectives and an Eppendorf InjectMan NI2 semi-automatic microinjection device permitting microinjection of any material into various samples. During the injection the sample can be visualised through objective lenses with a maximal magnification of 120x. The most frequently injected materials are DNA, proteins, tracers and chemicals with or without attached dyes.
How does it work?
Stereo microscopy is designed for imaging various samples at a low magnification. It typically uses two separate optical paths with two objectives and eyepieces to provide slightly different viewing angles to the left and right eyes. This arrangement produces a possibility for 3D visualisation of light reflected from the surface of the sample. Since the microscope is intended for low magnifications, long working distance objectives can be used for observation, leaving space between the objective lens and the sample. These characteristics enable detailed sample manipulation under the microscope. Additionally, stereo microscopes can typically be combined with fluorescence for more advanced applications.
Things to consider
The 3D effect is significantly dependent on the structure of the sample, such as thickness, opacity and contrast. In addition to the reflected light, most fluorescent material can also be imaged. The instrument at TBI is equipped with both b/w and colour CCD cameras to visualise fluorescent and non-fluorescent samples, respectively. For microinjection, commercial or self-made needles can be used. If the sample is alive, suitable living conditions have to be ensured for optimal results.
- Low magnification observation with availability of 3D vision.
- Can be combined with fluorescence imaging.
- Enables microinjection of material into various samples.
-
Photoacoustic microscopy
Photoacoustic microscopy
What is it for?
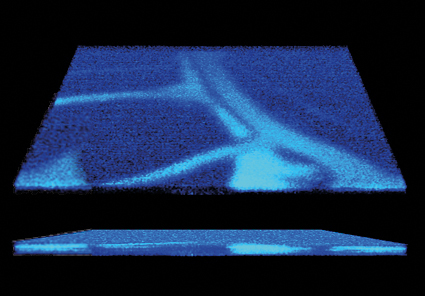
Photoacoustic microscopy (PAM) is an in vivo imaging technique that can generate high-resolution (μm-scale) images at depths of up to a few millimetres. PAM provides absorption contrast, similar to fluorescence techniques, but it does not require specific labels, which makes it a labelfree technique. Labelling is possible as well, if the molecule of interest does not naturally absorb light. PAM can be used for in vivo imaging; microvasculature, in particular, is a popular target due to the good endogenous absorption contrast of haemoglobin. Several other molecules can be imaged as well with visible laser wavelengths, e.g. lipids, water, collagen, DNA/RNA, bilirubin, cytochrome C and glucose provide intrinsic contrast for PAM in biological tissue. These endogenous contrast agents allow the visualisation of anatomical structures and the monitoring of functional indicators, such as blood oxygenation and temperature.
How does it work?
PAM is based on “listening” to the broadband ultrasonic signal that is generated by absorption of pulsed excitation light in the sample due to the photoacoustic effect. Such combination of optical excitation with acoustical detection preserves the diffraction limited spatial resolution, whilst extending the penetration depth to mm range, well beyond the reach of purely optical imaging techniques. In PAM, an optical resolution point-illumination-based method is utilised, when a focused laser spot is scanned through the field-of-view and for each pixel ultrasonic signal is recorded.
Things to consider
The PAM system in Turku is an in-house built experimental system. It can be flexibly configured for different applications and at the moment, it can be used in collaboration with our local experts. Our PAM system currently only has a 532 nm laser excitation source, and thus multi-wave length imaging is not currently supported.
- Label free in vivo imaging technique offers mm penetration depth with μm resolution
- Based on measuring the photoacoustic effect where light absorption within the sample triggers mechanical sound wave propagation to the medium
-
Fluorescence Correlation Spectroscopy
Fluorescence Correlation Spectroscopy
What is it for?
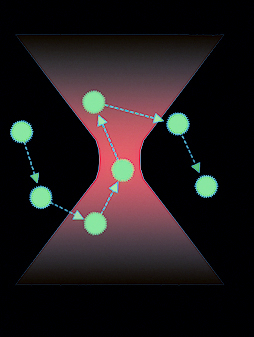
Fluorescence Correlation Spectroscopy (FCS), Fluorescence Cross-Correlation Spectroscopy (FCCS) and Raster Image Correlation Spectroscopy (RICS) are three techniques based on the analysis of fluorescence fluctuations in a femtolitre focal volume. These techniques can be applied in either a confocal or in a super-resolution STED microscope to provide information on parameters such as diffusion and concentration of labelled molecules. FCS, FCCS and RICS can also be used to identify and describe binding events, or by using variations of the focal volume, to follow plasma membrane dynamics in living cells.
How does it work?
Fluorescence spectroscopy techniques are normally implemented by counting photons over time on sensitive detectors such as avalanche photodiode detectors. Photons are collected and a correlation analysis of the fluorescence events is performed. Next, the correlation function is fitted to known mathematical models considering all processes that may contribute to the signal fluctuation to finally obtain quantitative information on parameters such as the diffusion coefficient and concentration. In the special case of FCCS, a two-colour signal is recorded in separate channels and in addition to the two individual autocorrelation functions, a third cross-correlation function between the two colours is calculated. The cross-correlation function is used to identify binding events between molecules labelled with the two different tags of choice. In RICS the illumination is not over a fixed local volume, as in FCS and FCCS, but instead the volume is moved to scan a larger region of interest. Laser scanning has to be done at such speed that the molecules will not move much before the laser can scan them again.
Things to consider
Fluorescence spectroscopy is used when quantifiable information about molecular dynamics is needed and not to create images. These techniques provide information about diffusion, concentration and binding events. Additionally RICS can generate diffusion and concentration maps containing information about changes in the dynamics from one location to another.
- Provides information about diffusion, concentration and binding events of labelled molecular species.
-
Live cell Imaging
Live cell Imaging
What is it for?

Live-cell microscopy is a versatile group of techniques allowing imaging of a living specimen. It is a preferred technique when the research question requires information about different phases of the cell life span rather than endpoint information. Possible applications for live-cell imaging could be studies of fluorescent protein behaviour in the cell and cellular processes such as endocytosis, apoptosis, cell division, protein diffusion and translocation of proteins. The effects of abnormal conditions, such as hypoxia or high or low temperatures can also be studied.
How does it work?
TBI offers several live-cell imaging platforms on which the cells could be visualised in real time. These instruments offer traditional transmitted light and fluorescence imaging as well as advanced methods from TIRF and high-content widefield fluorescence microscopy to high-throughput confocal microscopy. Functional cell imaging techniques, such as fluorescence recovery after photobleaching (FRAP), fluorescence loss in photobleaching (FLIP), photoactivation and FCS can also be conducted.
Things to consider
The primary requirement for live-cell imaging is the establishment of suitable conditions for the cells (CO2 level, humidity, and temperature) to protect normal cell function during image acquisition. Additionally, cells should be grown in a suitable dish for live-cell imaging. Cell culture media should preferably not contain a pH-indicator and, if the used instrument does not have a CO2 controller, it should be CO2 buffered. Exposing living cells to stressful environments can reduce their biological functioning or even lead to cell death. Living cells are very light sensitive, thus the minimisation of laser power and acquisition time during imaging is crucial. Additionally, high cellular concentration of fluorescent reporters can be toxic to the cell and should be optimised. Live cell imaging is always a compromise between achieving the best image quality and preserving the health of the cell.
- Live cell imaging enables the study of dynamic processes in living cells.
- Living cells are sensitive to surrounding conditions.
- Live-cell Imaging experiments have to be well planned.
-
Basic high-content imaging
Basic high-content imaging
What is it for?
In addition to more advanced high-content imaging devices, such as those based on confocal microscopy, there are simpler devices for basic high-content brightfield and fluorescence imaging. Typical examples are Cell-IQ and IncuCyte. The former has its own built-in incubator, whereas the latter is placed inside a normal cell culture incubator. These devices are typically rather easy to use, and can be used to image multiwell plates stably over several days. Typical studies include cell proliferation and migration assays, used for instance in drug screening.
How does it work?
Cells are cultured on standard plastic multiwell plates and placed in the imaging device. Imaging patterns are then set up (imaging frequency, positions and fluorescence settings etc.), after which the imaging goes on automatically, often with automatic focusing. The cells are kept under constant temperature and CO2 during imaging. When the experiment is finished, the images are analysed, using either software provided by the device manufacturers, or by third party software. In some cases, multiple images from a single well are stitched together during post-processing.
Things to consider
High-content experiments take a long time and produce a lot of data. Proper experimental design, timing and quantitative image analysis are important. When planning an experiment, one should also consider the time it takes for the device to capture one set of images. This can be rather long, and it limits how short the time interval between successive timepoints can be. As with all live-cell imaging, experiments are often a compromise between image quality, resolution and sample viability.
- High-content imaging techniques based on widefield microscopy can be used for migration and proliferation essays.
- Instrumentation consists of an incubator and an imaging device allowing long follow-up studies of e.g. cultured cells.

-
High-content microscopy
High-content microscopy
What is it for?
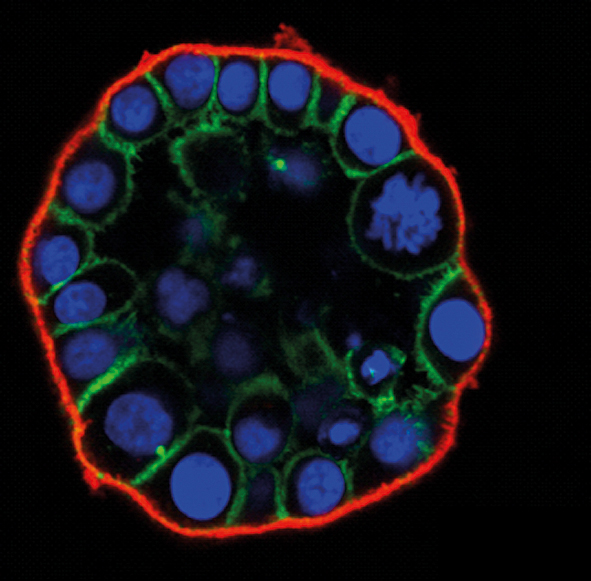
High-content imaging is a rapidly growing field of microscopy with a broad spectrum of applications that range from cell biology and basic research to pharmaceutical drug discovery. High-content imaging is now widely used in drug testing, systems biology, siRNA screening, and functional genomics.
How does it work?
High-content imaging typically relies on fluorescence microscopy experiments in which the biology has been adapted to multiwell plates, and in which image acquisition and subsequent quantitative analysis have been more or less automated. Often, two or more “multiplexed” assay formats are combined based on, for example, immune staining, reactive dyes, or traceable cells and cell lines that stably express fluorescent proteins. Many morphological properties can be analysed in parallel, including the expression or localisation of fluorescent labels within cells, changes in intensity over time, alteration in cell morphology and movement, quantification of cell proliferation versus cell death, as well as the characteristics of organelles, nuclei or the cytoskeleton. Simultaneous imaging of multiple cellular targets allows the analysis of numerous cellular features within a single experiment. With increased scale and speed of image acquisition and analysis, the demand for sophisticated instrumentation platforms is increasing. The hardware (the microscope) and software in high-content imaging systems are typically closely integrated, with the goal to standardise image acquisition, speed up image analysis and support data visualisation.
Things to consider
The high-content imaging process is typically divided into 4 stages: cell biology, image acquisition, image analysis, followed by data analysis and visualisation. Different high content microscopes provide diverse advantages that need to be carefully considered for each experiment. This depends on the experimental throughput, the desired image resolution, the inherent nature of the cells, and the matching assays utilised.
- High-content imaging uses integrated instrumentation for fast imaging of multiple samples and automated image analysis.
- Often used for fluorescence microscopy experiments.
-
FLIM-FRET microscopy
FLIM-FRET microscopy
What is it for?
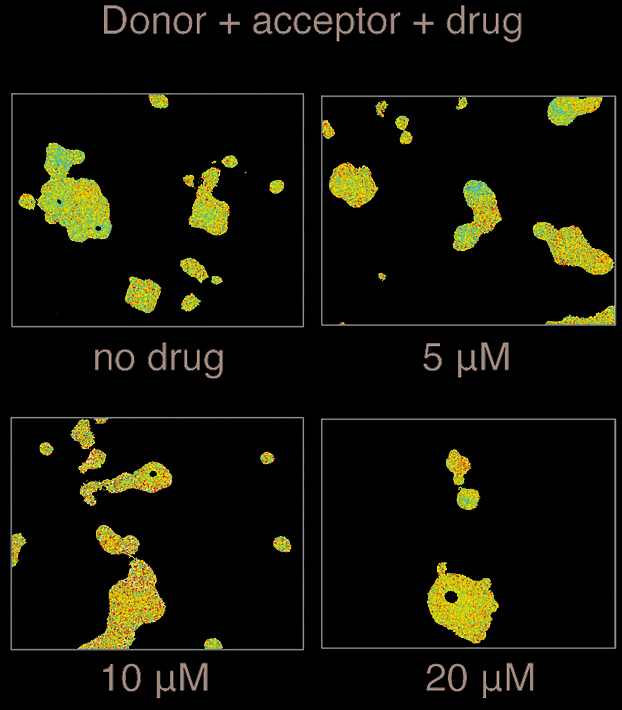
The automated high-throughput FLIM-FRET system enables high-content FRET measurements in a fast and precise way representing an ideal method for drug discovery and target validation. Fluorescence lifetime imaging microscopy (FLIM) is a sensitive and precise technique to create microscope images based on the differences in the fluorescence lifetime of a fluorophore, or in other words, based on changes in the exponential decay rate of fluorescence from a fluorescent sample. Given that the fluorescence lifetime of a molecule changes depending on environmental factors, like pH, temperature or fluorescence resonance energy transfer (FRET), FLIM can be used as a precise method to detect changes in such environmental factors. In particular, detecting FRET, an energy transfer phenomena caused by the close proximity of another fluorophore (typically less than 10 nm away) can be done precisely by FLIM. FLIM-FRET is useful to report on protein conformation changes and on protein-protein, protein-nucleic acid, and protein-small molecule interactions.
How does it work?
FLIM-FRET measurements are performed on a conventional inverted microscope with a frequency domain FLIM-FRET attachment that serves to excite the donor fluorophore and detect its fluorescent signal. The LI-FLIM software connected to the system then calculates the fluorescence lifetimes for each of the pixels in the image. For high-content applications, the FLIM-FRET system is equipped with an automated stage and focus drive that move and position the sample according to the specified locations. The stage can be used to acquire a sequence of images in a grid pattern on a microscopic slide, or to scan all the different wells of a 24-, 48- or 96-well plate. The system is also equipped with a focus compensation system that can correct changes in the z-direction.
Things to consider
FLIM-FRET has advantages over intensity-based FRET measurements because it is insensitive to the concentration of fluorophores and it does not suffer from cross-talk issues. However, as already mentioned, fluctuations in pH and temperature can affect the lifetime and therefore they should be kept as constant as possible.
- Useful for reporting molecular events such as protein-protein interactions in nm scale.
- Automated high-throughput ideal for fast drug discovery and target validation.
-
Flow cytometry and cell sorting
Flow cytometry and cell sorting
What is it for?
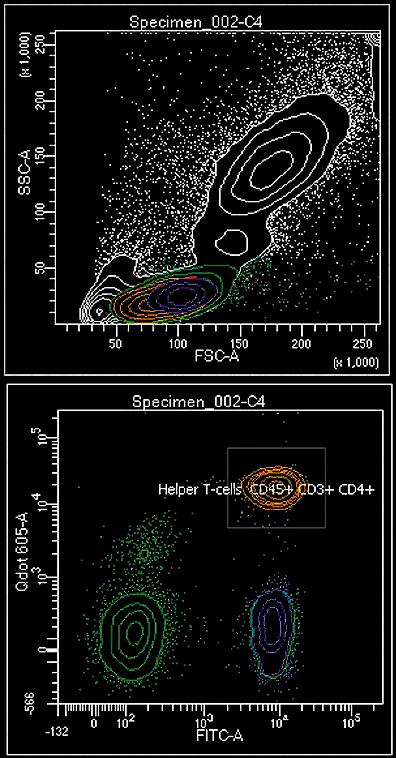
Flow cytometry is a laser-based technology for biomarker detection in cells and other particles, and is also used for sorting specific sample populations. It is routinely used in diagnosing blood cancers and other health disorders. It has many applications in basic research and clinical practice. Flow cytometric cell sorting is an efficient way to enrich cell populations quickly and with high purity. There are clear advantages of using cell sorting instead of, for example, magnetic cell enrichment. For instance, one can use several labels to choose exactly which cell population to isolate. There are no alternative methods for some enrichment procedures, such as sorting of GFP-positive cells.
How does it work?
First, the sample is pressurised and then analysable particles (cells) are suspended in a sheath fluid stream. The particles pass a laser in a queue, advancing at great speed (from 500 to >70000/s). When the particle passes the laser, its size, granularity and fluorescent properties are quickly measured and registered. In cell sorting, particles or cells are similarly run in a sheath fluid stream. The stream is converted to droplets by a vibrating nozzle. Each droplet optimally contains only a single cell or no cell at all. If one wants to collect a specific droplet, it will be given an electric charge. Then, high voltage deflection plates will guide the droplet into the collection tube or a multiwellell plate. The results of flow cytometry experiments can be analysed with specialised software, such as locally made Flowing Software: www.flowingsoftware.com.
Things to consider
Prior discussion with CIC personnel is vital. The cells have to be in a single cell solution. The fluorochromes have to match the lasers and detectors.
- Laser-based technology for cell/particle sorting and biomarker detection.
- Suspended cells or particles are individually registered or sorted.
- Several fluorescent labels can be measured simultaneously.
-
Microscope slide scanners
Microscope slide scanners
What is it for?
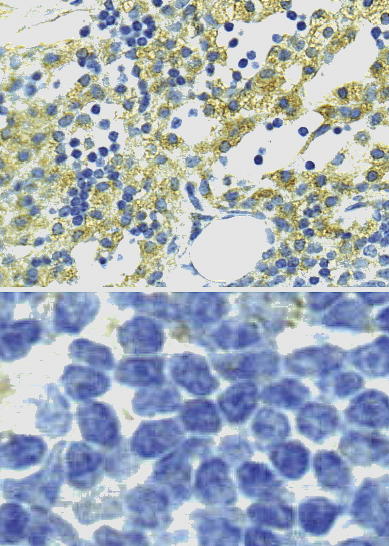
Slide scanners are used to automatically digitise entire microscope slides. Earlier, microscope-mounted cameras were used to capture histological details of interest, but modern whole slide imaging allows storage and sharing of all the histological information present on a microscope slide. This allows, for example, the visualisation of large digital datasets with so called virtual microscopes, and in this way slides can be evaluated by multiple persons at the same time. Moreover, advanced image analysis can be used for e.g. automatic tissue recognition. Two slide scanners are available: Pannoramic 250 Flash for brightfield imaging and Pannoramic Midi for fluorescence and brightfield imaging.
How does it work?
From the imaging point of view the slide scanners work in the same way as ordinary brightfield and fluorescence microscopes. In addition, they have fully automated scanning systems to produce digital slides from the whole slide area. The brightfield mode can image all stains that produce contrast in ordinary brightfield imaging. See the instrument specification list in this book for the available fluorescence wavelengths.
Things to consider
Care should be taken in preparing the slides to ensure good quality scanned images. Slides must be essentially free of any flaws such as cracks, crooked coverslips, bubbles in mounting medium, etc. Not all slide brands are compatible with the Pannoramic Midi because of their thickness variance, so contact responsible personnel for advice before preparing slides to be scanned in the Midi, especially fluorescence samples.
- Slide scanners digitise whole slides of tissue samples.
- Virtual microscopes can be used to visualise data in a convenient way or image analysis can be used for e.g. automated tissue recognition.
-
Optical in vivo imaging
Optical in vivo imaging
What is it for?
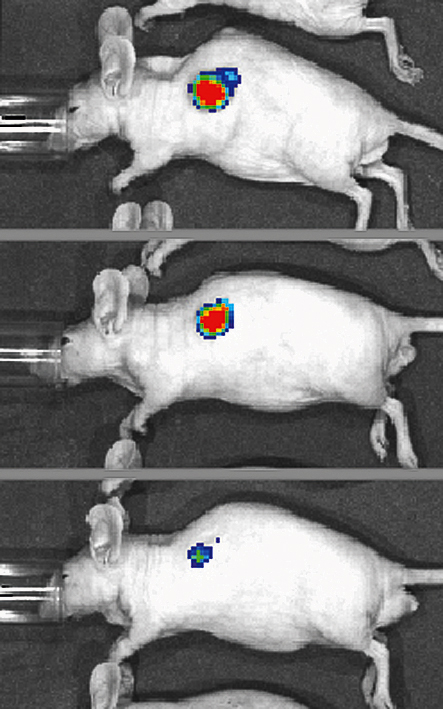
The IVIS optical imaging system provides quantitative fluorescence and bioluminescence imaging data from mice or rats in vivo. Cells expressing luciferase or labelled with a suitable fluorescent molecular species can be visualised with the IVIS Spectrum or IVIS Lumina II system. Macroscopic in vivo imaging enables, for example, phenotyping of transgenic mice, observation of tumour growth in a living animal, follow-up of treatment responses, visualisation of inflammation and infections and monitoring of nanoparticle delivery to designated targets. A principal application area is the study of oncological xenografts, in which cancer cells with bioluminescent/fluorescent reporters are inoculated into immunodeficient mice/rats. These oncology models can be used to assess anti-cancer therapies over the course of treatment in vivo. Non-invasive imaging of tumour growth and metastasis allows longitudinal evaluation of tumour development before, during, and after treatment, offering an excellent preclinical strategy for assessment of tumour response and recurrence.
How does it work?
The system employs a light-tight imaging chamber. Inside the chamber, a heated stage with built-in anaesthesia masks is available for five animals. The system has a CCD camera thermoelectrically (Peltier system) cooled to -90°C ensuring a low dark current and very little noise. The camera has high quantum efficiency over the entire visibleto- near-infrared spectrum. The stage is height-adjustable, allowing for a field of view of 5-12.5 cm. LED illumination is provided for reference photography, and a halogen lamp is available for fluorescence imaging. The system has a multi-position excitation filter wheel, and replaceable filter wheels to handle emissions at various wavelengths. All of these refinements are motor-controlled via IVIS Living Image software.
Things to consider
IVIS Spectrum or IVIS Lumina II is appropriate when fast or repeated imaging is required and a large number of animals are to be screened.
- Optical in vivo imaging of fluorescence and bioluminescence in small animals.
- Xenograft imaging, response follow-up and visualisation of inflammation and infection.
-
Micro-CT Imaging
Micro-CT Imaging
What is it for?

Micro-Computed Tomography (micro-CT) is a method whereby X-ray computed tomography affords resolution on a micrometre scale. Micro-CT images can be used for volumetric analysis of scanned samples and 3D image reconstruction.
How does it work?
In micro-CT, hundreds of digital X-ray images are obtained from a single sample, but with slight variation in the rotational angle. The spatial location of every voxel (a 3D pixel) can be geometrically calculated from the images. Resolution of such images is, at best, on the micrometre scale, depending on sample size; the smaller the sample, the better the resolution.
Things to consider
Micro-CT is strictly an ex vivo technique. Micro-CT is principally used for analysis of bone samples as part of basic research in bone biology, and in the study of various implant materials developed to correct defects in bone. In addition, micro-CT can be applied to soft tissues, which, naturally, are of varying densities. Vasculature can be visualised after perfusion of a radio contrasting agent after sacrifice of the animal. The use of micro-CT is somewhat limited because of the need for small sample sizes (maximally that of a thumb tip), and the relatively long times required for sample scanning (about 45 min) and reconstruction (approximately 10 min/sample). Analysis of sample density calls for proper machine calibration. It is preferable to try to scan the samples within a short time period as the X-ray source wears out upon time. If your study requires analysis of samples at time points very distant to each other you have to use a calibration according to the date of the scan.
- Ex vivo imaging technique for studying both biological and inorganic samples.
- 3D data reconstruction.
- Mainly used for studying rodent bone structure.
-
Ultrasound imaging
Ultrasound imaging
What is it for?
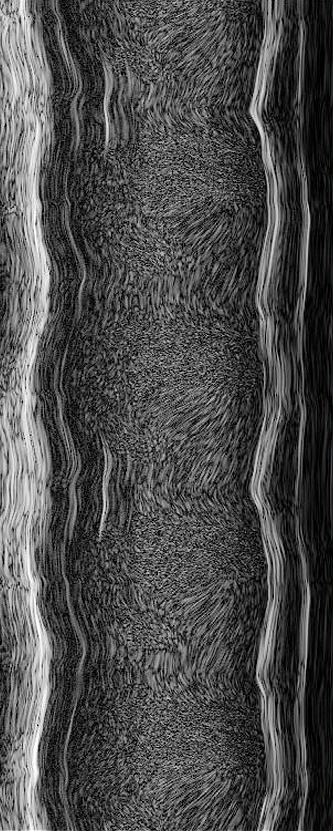
The high-frequency, high-resolution digital imaging platform with linear array technology and Colour Doppler Mode can be used non-invasively in a variety of animal models. This setting is especially effective in investigating cardiovascular function and structure, cancer and inflammatory-related processes.
How does it work?
A handheld transducer with a linear array of piezoelectric elements is used to produce acoustic pulses above 20 kHz that deliver sound waves into the animal’s body. Diverse tissues, organs and disease lesions absorb and reflect sound waves differently depending on their density. High-resolution grayscale images are produced when the partially reflected sound waves return to the transducer. The resulting image is instantly viewable and can be captured as a still photograph or movie. Although B-Mode, which displays a 2D cross-section of tissue, is the most common imaging mode with ultrasound, other image types can also be produced for studying physiological properties such as localisation and direction of blood flow, tissue stiffness and cardiac strain, vascularity, tissue motion over time and the presence of molecules and biomarkers.
Things to consider
As the apparatus is rather expensive and complicated to use, proper training is needed before one can use this equipment. The tip of the transducer is especially sensitive, avoid touching it with sharp objects or cleaning it with rough materials such as a hand towel paper. Although ultrasound imaging is a very versatile technique for in vivo imaging, not all questions can be addressed by using it. Ask advice from experienced users regarding your study design. This might improve your research.
- Ultrasound is a non-invasive technique for studying e.g. tumour xenografts and cardiovascular function and structure in animal models.
- Several imaging modes for different purposes exist, such as, B-mode, M-mode and the Colour Doppler mode.
-
PET imaging
PET imaging
What is it for?

Positron Emission Tomography (PET) is a non-invasive method for imaging biochemical and physiological processes in vivo. Minute amounts of biologically active compounds are labelled with positron emitting radionuclides and then administered to the subjects. The temporal and spatial distribution of these tracers within the body is visualised and measured with PET.
With PET it is possible to study tissue function and metabolism, the function of neurotransmitters and receptors, gene expression and drug pharmacokinetic/ pharmacodynamics profiles.
How does it work?
Positron emitting radionuclides are usually produced with cyclotrons. Short-lived (T½= 2-110 min) radionuclides are then incorporated into molecules of interest using sophisticated radiochemical syntheses. Due to the short half-life of the positron emitters, these syntheses have to be performed in a very rapid process. The tracers are then injected into the subject and a PET scan is performed. The images are reconstructed as tomographic images by mathematical processing of the data.
Things to consider
PET methodology always involves radioactivity and availability of suitable tracers is crucial for studying any phenomenon with PET. Time slots for radiosynthesis and PET scans should be planned carefully as projects are scheduled four times a year. Connecting with the expertise in existing groups is highly encouraged.
- Non-invasive method for imaging biochemical and physiological processes in vivo.
- Requires radiotracers suitable for highlighting physiological events.
-
PET, PET/CT and PET/MRI
PET, PET/CT and PET/MRI
What is it for?

Positron Emission Tomography (PET) is an unsurpassed method for imaging biochemical and physiological processes in vivo. Combined with Magnetic Resonance Imaging (MRI) or Computed Tomography (CT), PET findings are localised anatomically. PET is used in patients with cancer and in cardiovascular, neurological and inflammatory diseases in clinical medicine. PET combined with tracer kinetic models measures blood flow, membrane transport, metabolism and ligand-receptor interactions noninvasively and quantitatively. In drug development, PET characterises drug candidates in the early stages of development, including studies for pharmacological mechanism of action, pharmacokinetics, therapeutic dose range, subject selection and stratification.
How does it work?
Minute amounts of biologically active compounds are labelled with positron-emitting radionuclides (11C, 15O, 18F, 68Ga) and administered to subjects. The temporal and spatial distribution of the tracers within the body is measured with PET cameras. The data is reconstructed as tomographic images by mathematical processing. CT or MRI images are overlaid with PET images. Data is analysed mathematically and visually. See also section for the Carimas-software.
Things to consider
PET is a quantitative method. For the full use of the data, imaging, modelling and analyses should be carefully planned with PET experts. While Turku PET Centre offers ~40 PET tracers for human use, the availability of a suitable PET tracer needs to be checked well in advance. A new tracer requires strictly regulated setup and validation for human use (GMP). The authorities consider PET tracers as drugs but a “microdosing” concept is applied. PET involves the use of radiation and Ethics Committees require calculations of radiation burden to subjects. Usually, the amounts of radiation remain low.
- A quantitative, non-invasive method for imaging physiological processes in humans.
- PET can offer cost-effective data for drug development
-
PET tracer development
PET tracer development
What is it for?
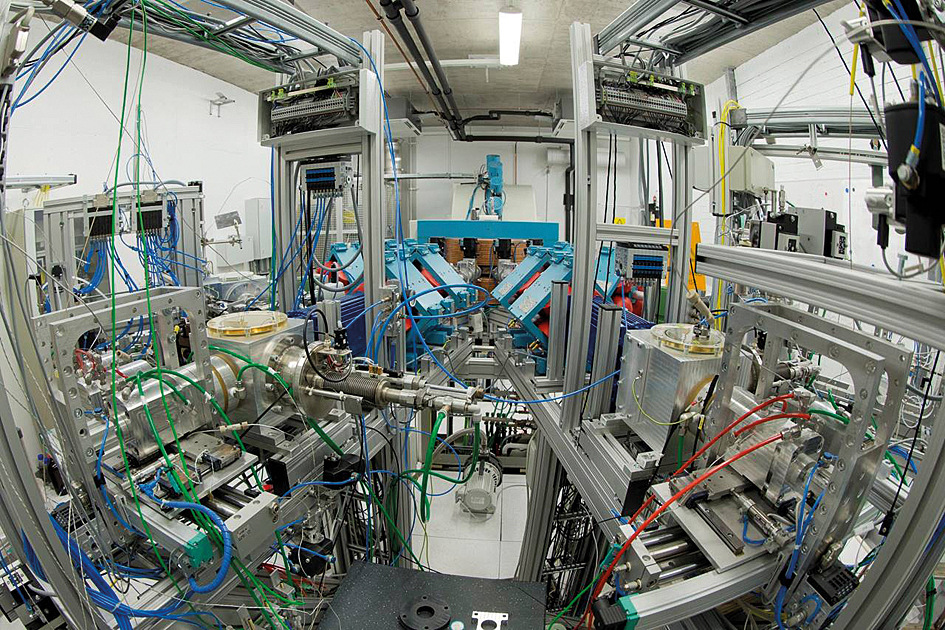
PET tracer development is a pre-designed, well organised and documented package of validated work stages that leads to a high-quality radiotracer (or radiopharmaceutical) to be used as a diagnostic tool in PET. Radiotracers are labelled with short-lived radionuclides, such as 11C, 15O, 18F and 68Ga that decay with positron emission. The goal is to develop a robust and reproducible production procedure for the radiotracer, the characteristics of which can be reliably analysed and can be safely used in both preclinical and clinical studies.
How does it work?
The following methods are developed and optimised during radiotracer development:
- Production of the radionuclide with a cyclotron using an appropriate nuclear reaction or a suitable radionuclide generator
- The chemical reactions with which the radionuclide is attached to the unlabelled molecule in order to obtain the desired radiotracer
- Procedures to isolate/purify the desired radiotracer from side-products
- Suitable formulation medium for the radiotracer, applicable for i.v. injection
- Sterilisation of the radiotracer
- Quality assurance of the radiotracer
The entire development process is validated through a Process Verification procedure, a series of three consecutive production runs with full quality control.
Things to consider
Radiotracers are administrated as “trace” amounts, typically less than 1 μg, that do not induce any pharmacological effects. Hence, the specific radioactivity (SA, proportion of radioactivity to the tracer mass) is very high. A good radiotracer binds to its intended biological target with good selectivity and specificity and has a suitable metabolic profile for the study in question. EU guidelines of GMP (adequate facilities, qualification of devices, validation of methods, and training of personnel) have to be applied throughout the PET tracer development.
- In PET, radiotracers are diagnostic tools that can be used for highlighting physiological or metabolic details.
- In radiotracer development, radionuclides are synthesised into suitable tracer molecules.
-
Image Processing
Image Processing
What is it for?
Bioimaging devices often produce images plagued with noise, unwanted movement, focus drift or out-of-focus haze or images that simply require some pre-processing before they can be used. Today, raw bioimages are seldom usable as they come out from an imaging instrument – image processing is needed before the images can be properly visualised or quantitatively analysed. Image processing is used, for instance, to remove different types of noise, register images so that unwanted movements over time are compensated for, or to perform arithmetic or morphological operations. Image processing also covers areas such as reconstructing 3D datasets from tomographic data, or using deconvolution to improve image quality. Image processing also entails such basic adjustments as brightness and contrast, or inverting images or changing their pseudo colour palette.
How does it work?
Image processing is most often performed with specialised software, although generic image processing software can be used in some cases. The desired software is first identified, downloaded and installed, and then the correct algorithms and settings are determined. Image processing can also be obtained as a service, guaranteeing fast and reliable results but enabling scientists to be involved as much as they want to be.
Things to consider
For basic adjustments, such as brightness and contrast, software with graphically represented algorithms is recommended to follow the norms of scientific publications.
- Image processing should be kept to a minimum, especially before quantitative analyses.
- Image processing cannot “create” new resolution or data, but it can destort it and introduce errors.
- Apply with care and consult experts whenever possible.

-
Image Analysis
Image Analysis
What is it for?

Today, displaying bioimages is not sufficient for reliable scientific conclusions or proper publications – quantification of images is a requirement. Within the last 15 years, bioimaging has transformed from a qualitative to a quantitative science. Without image analysis, images are only data, not yet information. Image analysis is needed to convert the data into valuable and understandable information. Image analysis can be divided into two main groups. In voxel-based analyses each voxel of the image is analysed separately, for instance to quantify colocalisation between two different markers. In segmentation-based analyses the image data is first segmented, meaning that it is divided into objects that the computer can identify. After segmentation, the number, size, shape and distribution of the objects can be quantified. Before image analysis, image processing (see previous section) is often needed.
How does it work?
Biomedical image analysis requires specialised open source software. The desired software is first identified, downloaded and installed, and then the appropriate workflows are determined (intermediate steps, algorithms and their settings, statistical analyses, etc.). In some cases tailored modifications and programming are required. Image analysis can also be obtained as a service, guaranteeing fast and reliable results but enabling scientists to be involved as much as they want to be.
Things to consider
Image analysis offers endless possibilities and can revolutionise bioimaging.
- One should know exactly what each step does and how/why.
- Use with care and consult experts whenever possible.
-
Visualisation
Visualisation
What is it for?

While quantitative analyses nowadays produce the actual results of bioimaging experiments (see previous section), generating visual representations that illustrate the quantitative results is often needed for publications and presentations. Visualisations are also frequently used as an aid when image processing and analysis workflows are being set up. With 2D image data, visualisation is simple and regular photo processing software can sometimes be used. With 3D image data, special software is needed to either project the 3D data onto a 2D plane (e.g. maximum intensity projection) or to create 3D renderings. The latter can be either translucent volume renderings or surface renderings based on tiny geometric primitives. Stereo/3D images and movies can also be created and they are often the best method to convey 3D structural information.
How does it work?
In most cases special 3D rendering software is used to create either volume or surface renderings, or combinations of both. After identifying, downloading and installing the required software, each data channel is set up separately, and data channels must not be confused with different colour or opacity channels.
Things to consider
Compared to image processing and analysis, there is more freedom in visualising, because the visualisations are not used for scientific conclusions. Consult experts if creating suitable visualisations or videos seems challenging.
- Avoid red-green superimposed images as these are often unclear especially for colour-blind people.
- Quantitative analyses must be done on original image data, never on visualisations such as projections or 3D renderings.
- Colours should only be used if they are essential for conveying the information being visualised.
-
BioImageXD-software
BioImageXD-software
What is it for?

BioImageXD (Kankaanpää et al. Nature Methods 2012) is an open source software package for processing, analysing and visualising multidimensional biomedical image data. It is especially suitable for 3D and 4D cellular images, but can be used with any type of image data. BioImageXD is among the most versatile bioimage informatics tools available, capable of doing most of the things described in the preceding three sections. This covers tasks such as noise reduction, morphological operations, colocalisation analyses, segmentation-based analyses, motion tracking, deconvolution, 3D rendering and 4D animation. BioImageXD can also be used to automatically process large amounts of data, such as high-content imaging results. BioImageXD has been referenced hundreds of times, and it is used worldwide in numerous research projects, from neuroscience and parasitology to cancer medicine and virology.
How does it work?
BioImageXD was developed based on six leading principles: open source code, extensive feature set, usability, full adjustability, applicability for present-day imaging needs and easy extendibility. The software can be downloaded free of charge, and it reads common microscopy and image file formats directly. Images are read into memory only when needed, not automatically upon loading, enabling quick loading and processing of large amounts of data. The user interface of the software is based on a single, large window and colour-coded settings. Nearly all features of BioImageXD can be run through its Batch Processor, which enables the set-up of complex workflows without any need for programming, and allows the processing of hundreds or thousands of images in one go.
Things to consider
For bioimage informatics, it is nowadays recommended that open source software be used, due to the transparency required for scientific work (“you have to know what your algorithms do”). As any advanced bioimage informatics software, BioImageXD is not always easy to use, but in scientific image analysis there are no shortcuts or “magic buttons”. Consult expert help if needed.
- BioImageXD-software is especially suitable for processing, analysing and visualising 3D and 4D cellular images.
- Free and open source software supporting several file formats.
- Easy-to-use Batch Processor for complex work flows.
-
Carimas-software
Carimas-software
What is it for?
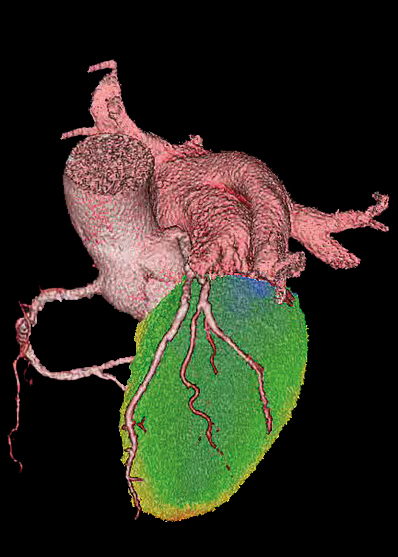
Carimas is a software platform for processing medical images generated by the most commonly used modalities, such as PET, SPECT, CT and MRI. It is a very useful analysis tool for PET imaging data. A large number of visualisation tools, ROI/VOI(region/volume of interest), numeric analyses and modelling methods are included.
How does it work?
Carimas supports Dicom and many other medical image formats (Ecat, MicroPET, analyse, interfile and Nifti). It includes four basic parts: visualisations, segmentation, modelling and reporting. Volumetric and dynamic images can be visualised. In addition to several defined shapes and volumes included within the software, users can manually define ROI/VOI if required. Automatic segmentation is available. Carimas provides the basic curve fitting methods, PET-specific graphic analysis and modelling methods. A report containing patient information, fitted curves and estimated parameters can be saved and printed. A few plugins (specific tools) for cardiac PET studies have been implemented. All analysis statuses and results can be saved. A special connection via intranet with PACs is available for effective data transfer.
Things to consider
All medical imaging data, such as PET/CT, SPECT/CT, PET/ MRI and small animal PET/CT, can be visualised and analysed using this platform. It is a very useful tool for PET dynamic studies, since a large number of graphic analyses and modelling methods are included (over 20 validated models). In PET studies, you need to scan patients or animals using conventional or novel radionuclide-labelled tracers that target specific tumour biomarkers, diseased tissues or certain cellular signalling pathways. Unlike clinical imaging data, PET research data usually need to be further analysed using specific computer software as an assistance tool, since most required parameters, such as absolute myocardial perfusion values, glucose uptake index of myocardium or skeletal muscles and ligand-receptor binding can be estimated only after complicated mathematical processing.
- Carimas software is developed for processing, analysing and visualising medical images obtained with e.g. PET, SPECT, CT and MRI.
- Supports several medical image formats.
- Offers several validated models for dynamic studies.
-
AMIDA-software
AMIDA-software
What is it for?
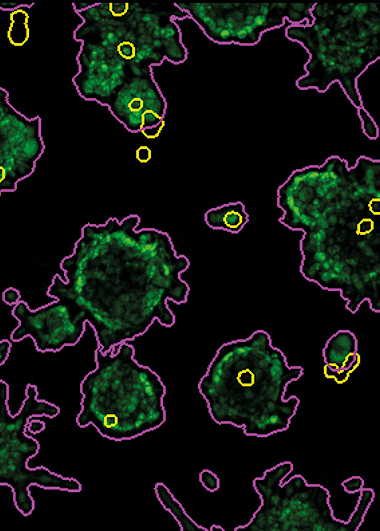
AMIDA (Automated Morphometric Image Data Analysis) is a software package for the rapid analysis of large numbers of confocal microscopy images. It was specifically developed to fill an unmet need in automated image analysis of complex 3D cultures.
AMIDA can extract a number of morphometric features based on size, shape or texture of multicellular organoids formed in organotypic cultures. As a key component of a phenotypic screening platform, AMIDA is ideally suited for investigating a broad spectrum of defined, biological questions in drug discovery as well as personalised medicine. Technology and screening platforms are applicable for multiple types of research, such as quantitatively measuring the response of primary cancer cells or cell lines to drugs, siRNAs or other perturbations.
How does it work?
AMIDA combines the effective capture of the inherent complexity and dynamics of micro-tissues with high experimental throughput. Instead of analysing single organoids or spheroids in detail, hundreds or thousands of such structures can be analysed in parallel. This approach enables researchers to address many biologically and physiologically relevant features inherent to living tissues. These include aspects such as differentiation and maturation of functional properties, heterogeneity and dynamics; cell-cell and cell-matrix interactions and the role of the microenvironment. AMIDA further has a strong focus on quantitatively measuring cell motility and invasion e.g. of cancer cells in 3D matrices.
Things to consider
Different versions of AMIDA exist: the free open source software allows analysis of small numbers of images, such as phase contrast or confocal microscopy images. The proprietary and continuously developed rAMIDA version, in contrast, can handle thousands of complex images (stacks of confocal microscopy images or maximum projections) in batch mode, preferentially in the frame of high-content drug screening campaigns and in collaboration with the University of Turku’s HCS Lab.
- Software package for highthroughput automated morphometric analysis of confocal microscopic images.
- A research tool suited ideally for drug discovery and personalised medicine.
-
Video production
Video production
-
Print material
Print material
-
Motion graphics
Motion graphics
-
MSc degree programme
MSc degree programme
The MSc Programme in Biomedical Imaging aims to train professionals to have a thorough understanding and practical skills in a wide range of imaging technologies, methods and applications.
More information on our programme page here ->
-
Instrument training
Instrument training
